Motivation
Q1 → 1% of women at age forty who participate in routine screening have breast cancer. 80% of women with breast cancer will get positive mammographies. 9.6% of women without breast cancer will also get positive mammographies. A woman in this age group had a positive mammography in a routine screening. What is the probability that she actually has breast cancer?
ALERT - Solving this question using a calculator and Bayes’ Theorem is easy. What I challenge you to do is without picking up your calculator or writing a single digit, estimate the answer upto an accuracy of let us say $\pm 5\%$. And yes, you are allowed to use pen-paper but only for diagrams.
tl;dr Try to estimate the answer, without explicitly applying the Bayes’ Theorem.
But why, would be your next logical question. Well, take a simpler question.
Q2 → Given a 10-faced fair dice, what is the probability that it will land upon a number which is even but not divisible by 3? You won’t even take 10 seconds, to do this question. You are proficient with a question like this to the extent that you can imagine all the possible 10 dice throws and consider only those in which an even number not divisible by 3 comes. Aka, you can intutively reason about the question without picking up pen and paper.
But can you do the same for the original question asked ? Well, if you can and got the answer correct by merely eyeballing, then you may altogether ignore this blog post. But if not, then join me on this fruitless exercise.
Abstract
In the coming few paragraphs, We will try to gradually build up on different visualisations for different kind of scenarios. I assume you already would know some of these, but the idea here is not to merely show the method, but to inutively question the “why”
Independent Events
Before handling questions where events are inter-dependent on each other making things complex (as seen in Q1), first let us handle the simple cases.
Case 1: A single event (Using Q2 as $A$)
Let us say we have an event $A$. Let, the probability of the event be $P(A)$. Now how do we visualise this probability -
- Let all the possibilities be named as $a_{1}, a_{2}, … $. Now formally $P(A) = \frac{n(A)}{n(Total)}$, where $n(A)$ stands for the number of possibilies where event $A$ happends and $n(Total)$ stands for the total number of possibilities.
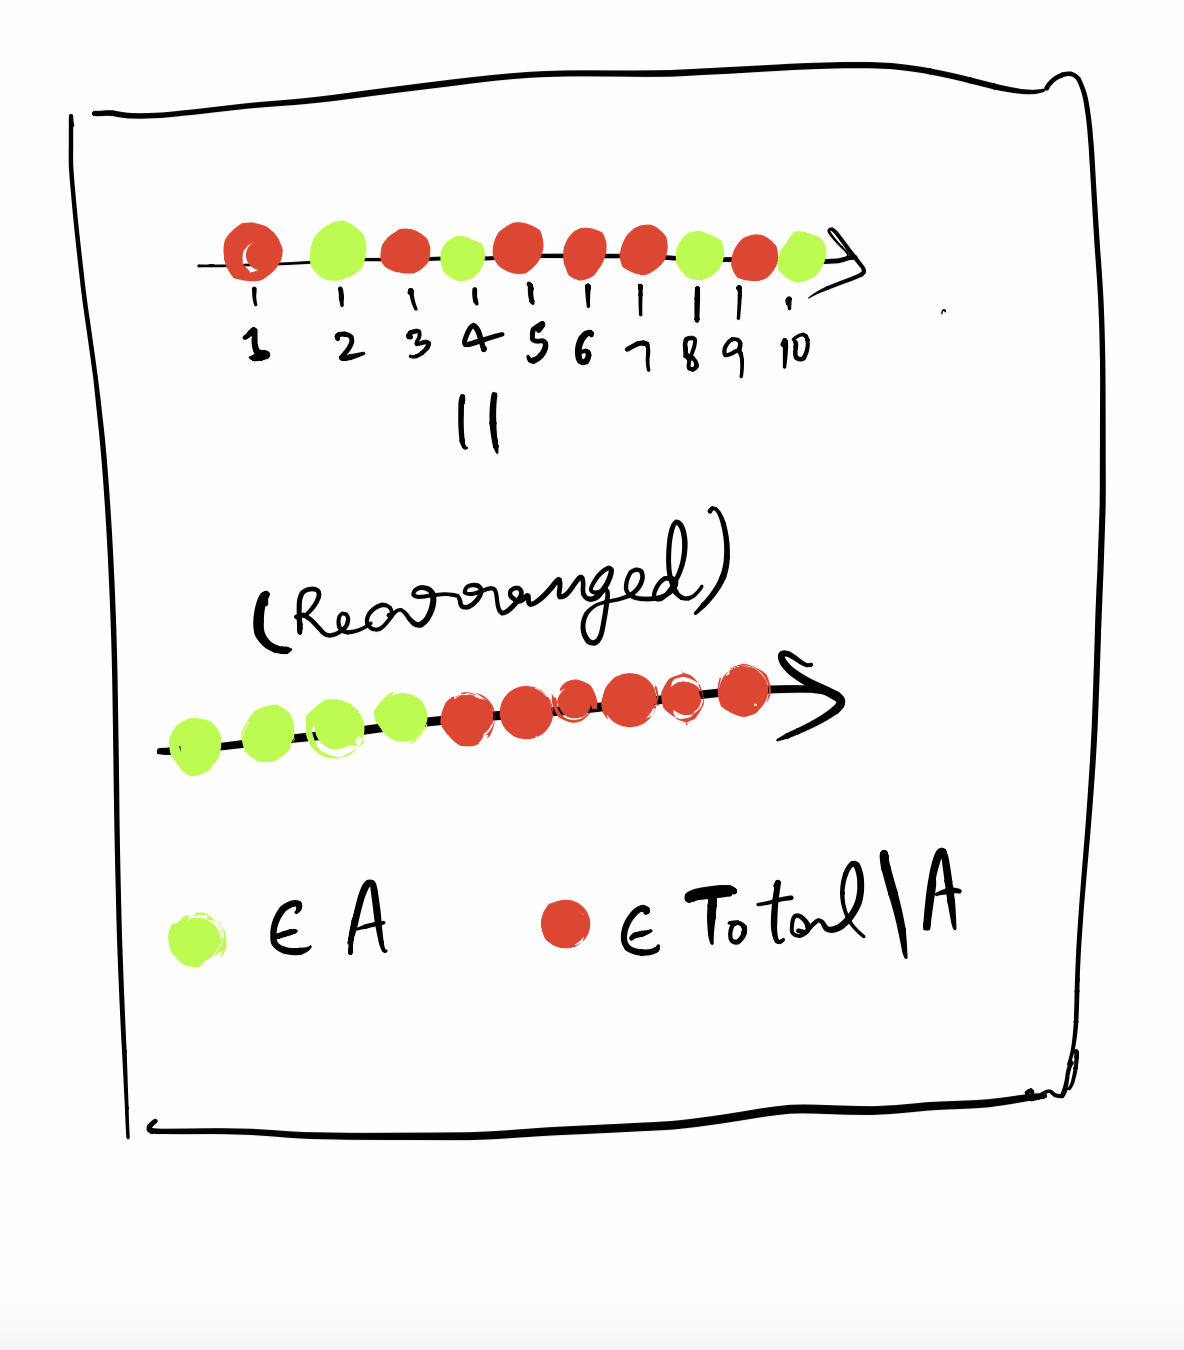
- So we could represent all these possibilities $a_{1}, a_{2}… $ as points on an axis, and let the green points be those which belong to $A$ and red points be those which don’t.
Case 2: 2 independent events
Let us say we have another event $B$ and similarly let us define $P(B)$ as the probability of $B$ happening and $b_{1}, b_{2}, … $ be all the possibilities, out of which a subset of them belong to $B$ and others don’t, such that $P(B) = \frac{n(B)}{n(Total)}$ Let B be those sequence of 2 coin tosses in which #Heads = 1, i.e {HT, TH}, and total sample space be {HH, HT, TH, TT}. We can clearly see that A and B are independent of each other, aka result of one of the events DOES NOT AFFECT the other event.
- Now how do we represent this visually ?
- On the same line can we put both the events? Not in this case, because the underlying sample space is different. For some cases we might have got this opportunity if A and B were on the same underlying space. But even then putting on the same line never turns out to be useful.
- So what we do instead is use a 2d space.
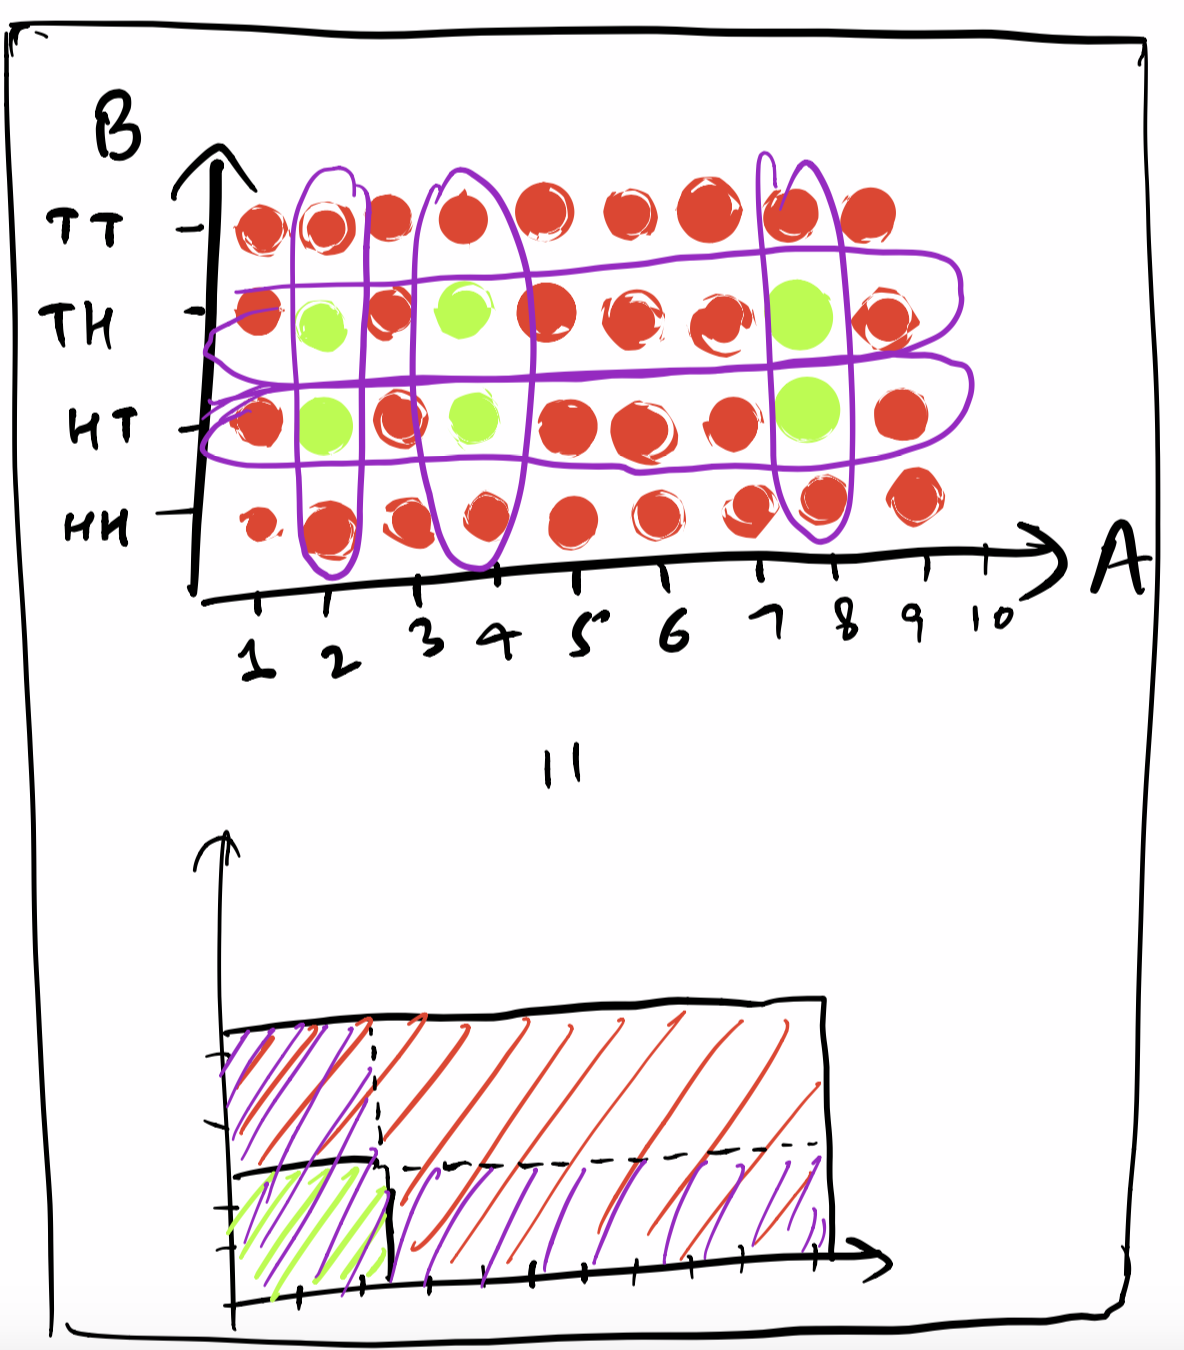
- Let us try to determine $P(A \cup B)$, it should basically be n(pairs of $a_{i}, b_{j}$, where $a_{i} \in A \text{ or } b_{j} \in B$) / n(all possible pairs), i.e in purple.
- And what about $P(A \cap B)$, it should be n(pairs of $a_{i}, b_{j}$, where $a_{i} \in A \text{ and } b_{j} \in B$) / n(all possible pairs), i.e in green.
Dependent events
Dependent events are tricky to work with. You can’t consider them dimensionally different like indepedent events, because one event happening can be related to another event happening. Now each possibility in the sample space can be defined by two things, {did A happen, did B happen}, this {bool, bool} pair represents each sample unit.
Consider $Q1$ where A = having positive result in the test (Green) and B = having cancer (Red)
Now when representing all these events, if we represent them on a line, how will you arrange them ? You might consider ordering all these 4 pairs, something like this {(True, True), (True, False), (False, True), (False, False)}. But uh, this destroys some relationship informations.
Example: n(True, True) / (n(True, True) + n(False, True)) = $\frac{P(A \cap B)}{P(B)} = P(A | B)$, can no longer be easily seen.
So, we again need two dimensions, however now they are just being used so that the subset/superset relationships between these 4 possibilities can be depicted easily. The key here is to get WHY is two dimensional venn diagrams enough and WHY does 1 dimensional not make it.
Well, consider what all relationships we want:
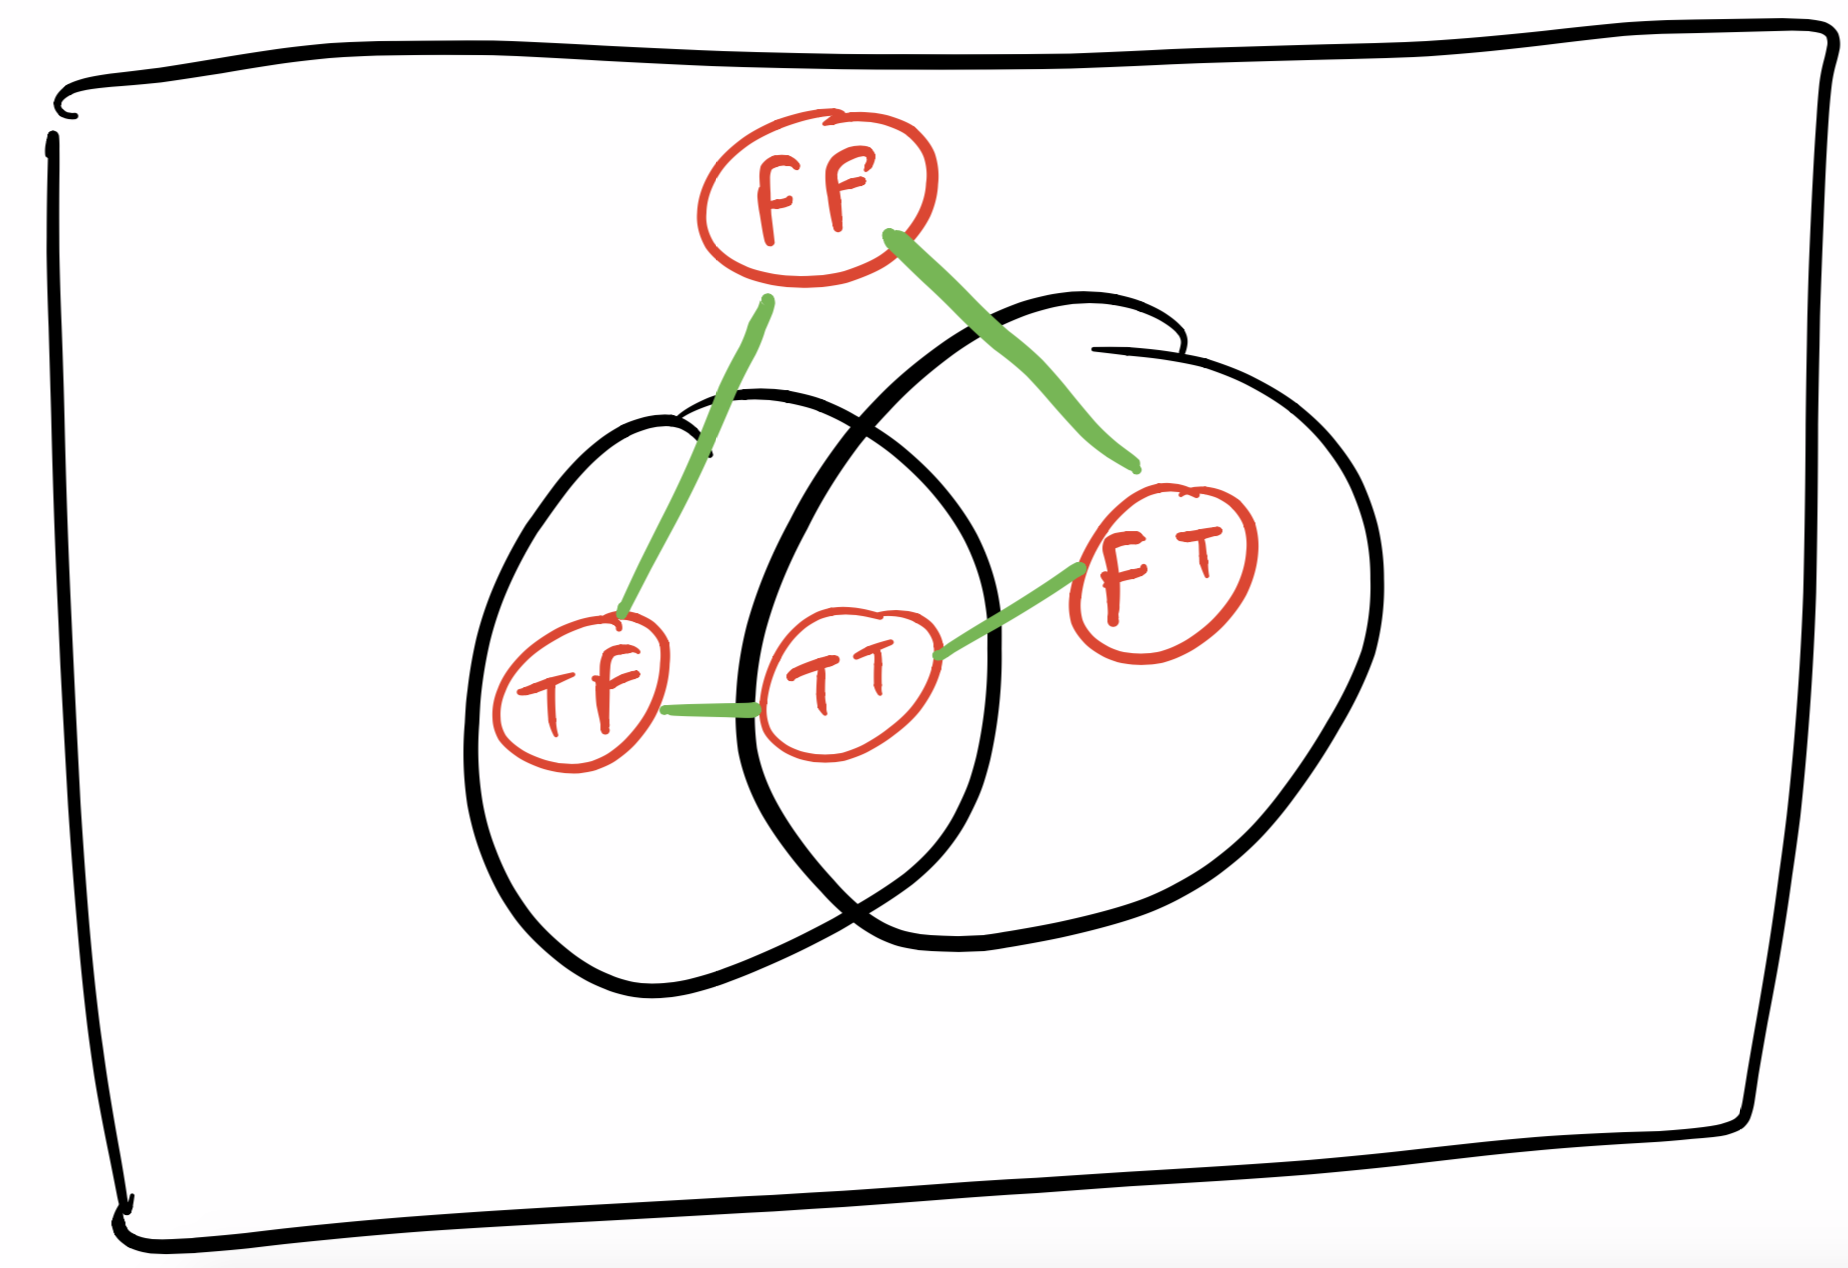
- (True, True) connected with (True, False)
- (True, True) connected with (False, True)
- (True, False) connected with (False, False)
- (False, True) connected with (False, False)
Basically (a, b) is connected with (a, not b) and with (not a, b). Now there are 4 nodes and 4 edges so we can’t represent this WITHOUT a cycle. It actually looks like a diamond and that is why you need the 2-dimension. In one dimenion, you can represent a chain but not a diamond.
The venn diagram actually emulates this diamond. All the egdes in the diamond can be seen as edges shared between different regions of the venn diagram. Sharing an edge is a much stronger relationship and actually establishes superset/subset area relationship as compared to merely sharing a vertex/point in the venn diagram.
Case 3: 2 dependent events
So now just represent A as a circle and B as another circle. What does LHS of Bayes’ becomes ?
$P(B | A) = $Intersection area / Area of A = Purple Area / Green Area
where Intersection area = %age area of B, where the $\%age = P(A | B)$
Therefore Intersection area $= P(A | B) * P(B)$
And Area of A = P(A) = Intersection area + Remaining area $= P(A | B) * P(B) + $ %age area of A i.e not in B $= P(A | B) * P(B) + P(A | B^c) * P(B^c)$
Now put intersection area / area of A = the RHS of Bayes’ theorem.
So, the question remains that you JUST need to estimate the ratio of the intersection w.r.t to A.
Here we go:
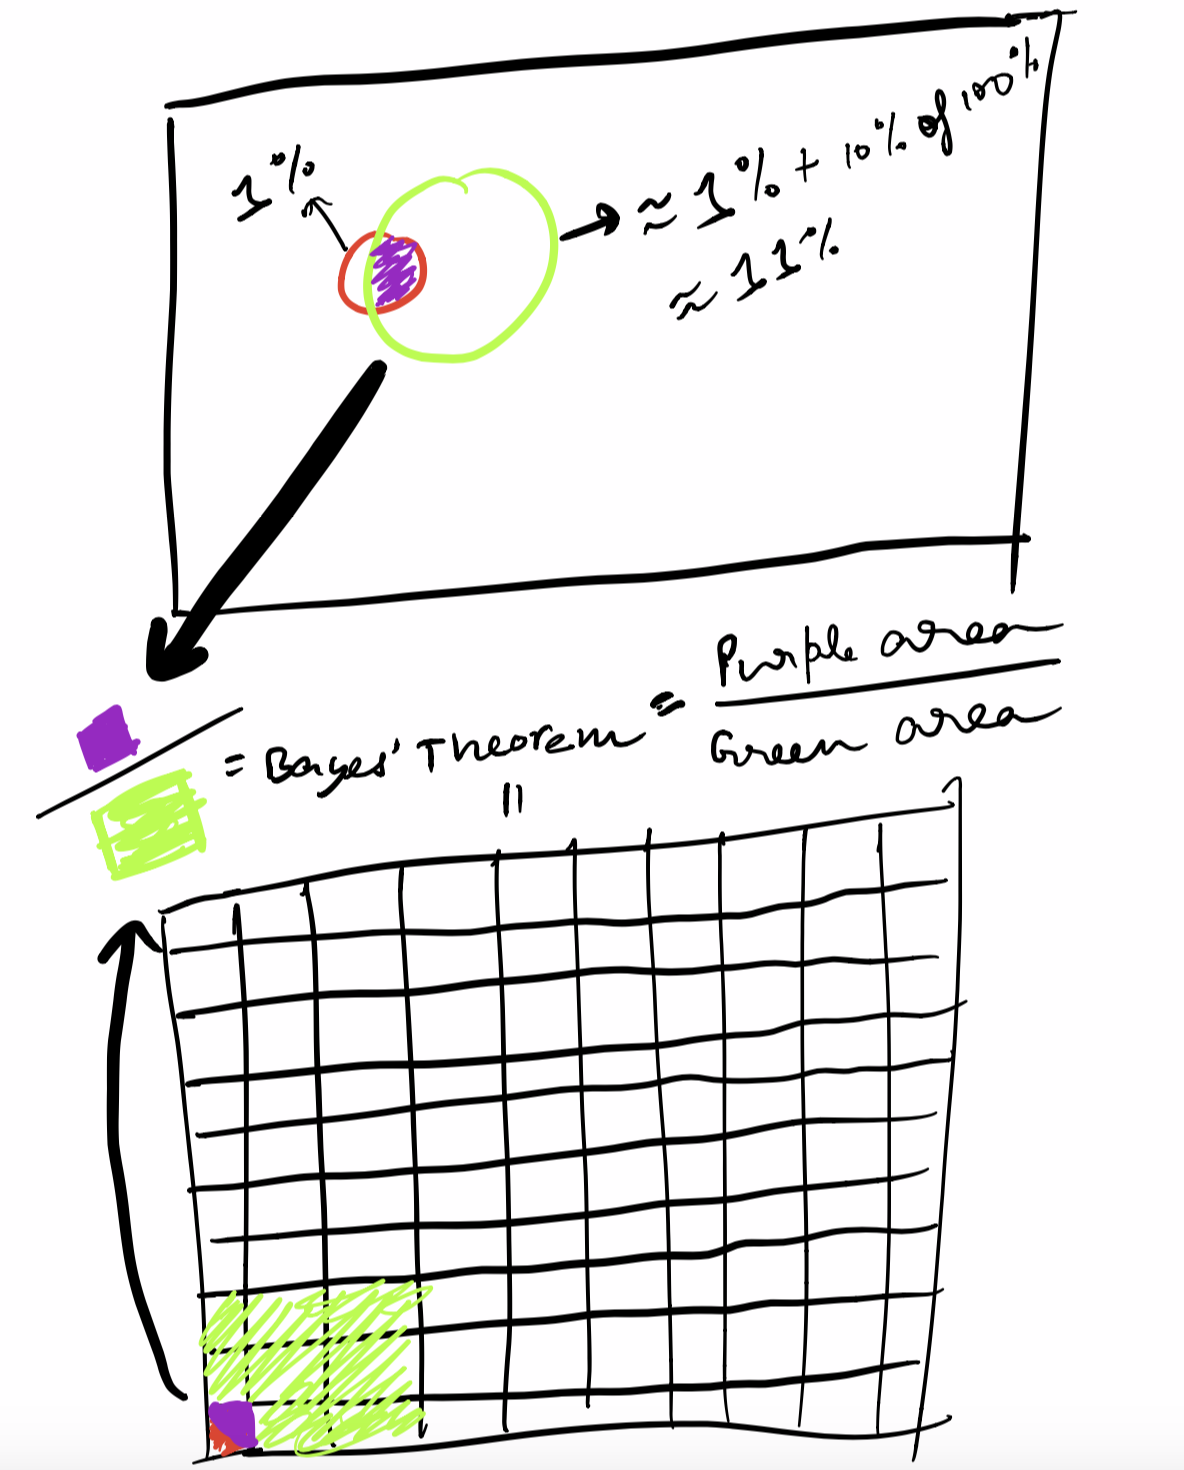
The crude approximation here is: Circle B is 1% (given) and intersection area of it is 80% wrt to B (given) , so intersection area is $0.8\% \approx 1\%$
Now the area of Circle A is $\approx 1\% + (9.6\% \text{ of } 99\%) \approx 1\% + (10\% \text{ of } 100\%) \approx 11\%$.
So, approx answer is $\frac{1\%}{11\%} \approx 9\%$
Is this correct ? Nope, but it is close enough. $_{\text{ actual answer is around } 7.76\%}$
Key takeaway: Bayes’ is just a smart way of looking at ratio’s with unknown information.
Things to ponder about: Can we use rectangles instead of circles, when using venn-diagrams ? Also, is there any label we can put on the x-axis and y-axis for dependent events for venn diagrams?